Pressure-test ranges before the market moves beyond them
A live read on where offers are actually landing versus your survey anchor - the exact gap, role- and geo-specific - before it shows up in rejections or above-range exceptions.


"We built the range midpoints off of Radford, but is it still right?"
Why this comes up
Survey data captures what the market looked like when it was collected. By the time it's released, aged, and built into a range, the signal is often months old - and the gap can be 2% for some roles, 30% for others. Compa Offers gives a live read on where offers are actually landing.

When ranges are built on stale survey data, the first signals are typically candidates declining, recruiters going above-max, or new hires coming in above existing employees. By then, the correction is reactive and expensive. Surveys can’t tell you what’s happened in the last quarter or even two quarters.
Survey data is a snapshot; Compa Offers i s designed to move. When the market for a role shifts - hiring pressure, a competitor's offer strategy, a new geography - offer data reflects it. Pressure-testing a survey anchor against live offers tells you whether the anchor still holds.
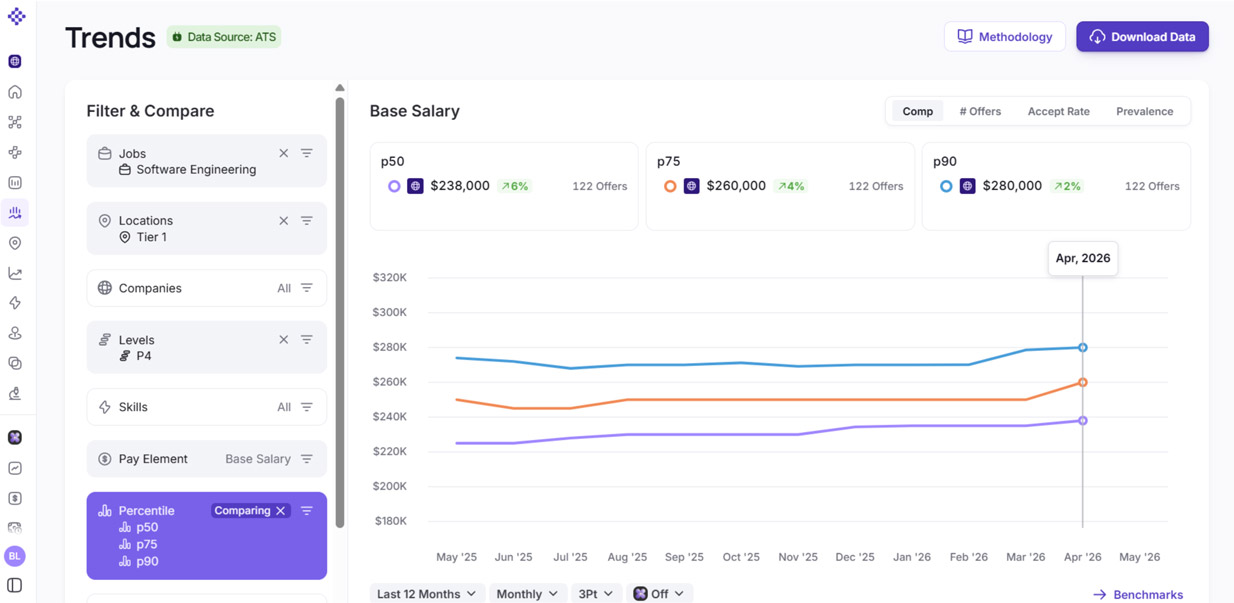
- Live offer percentiles (p50, p75, p90) for the role, level, and geo.
- A directional read on movement — is the live market above your anchor, below it, or aligned?
- A quantified gap - the exact delta, not an estimate.
- Role- and geo-specific signal with sample sizes, so you know a pattern from an outlier.
- A clear decision point: stay at the anchor, split the difference, or move the midpoint.
- Pulling additional survey cuts that all work from the same lagged data.
- Anecdotal triangulation from recruiter feedback and candidate conversations.
- Waiting for an above-range exception or a candidate decline to learn that the range has drifted.
- Manually building a comparison spreadsheet every time a range is questioned.

Offers Data